
|
|
VLA Low-band Ionosphere and Transient Experiment (VLITE)
Imaging
|
|

|
The astronomical imaging component of the VLITE project is based on a dedicated pipeline
that was developed by NRL within the Obit
and AIPS software packages.
VLITE data support the VLA through value-added PI science while the large field-of-view of
VLITE enables a new stand-alone astrophysics component to study individual sources or
samples of sources that fall well outside the primary observing band field-of-view.
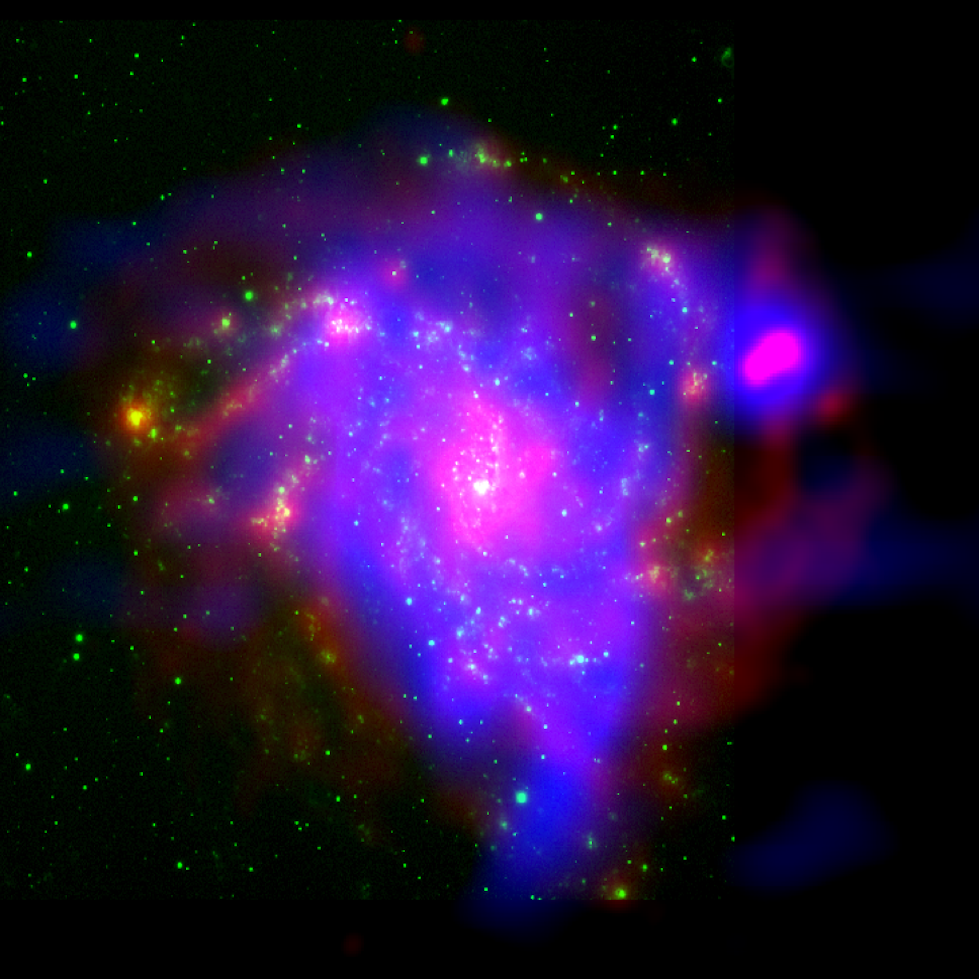
Radio (VLITE 90 cm and VLA 20 cm) and optical (KPNO 2.1-m H alpha) image of the Fireworks Galaxy NGC 6946, a medium-sized,
face-on spiral galaxy about 22 million light years away from Earth. The VLITE data were fully processed through the VLITE pipeline.
(Credit: Radio (blue) from VLA Low-band Ionosphere and Transient Experiment on the NRAO VLA and (red) from the NRAO VLA.
Optical (green) from the Kitt Peak National Observatory 2.1-m Telescope. U.S. Naval Research Laboratory/ Dr. Tracy Clarke)
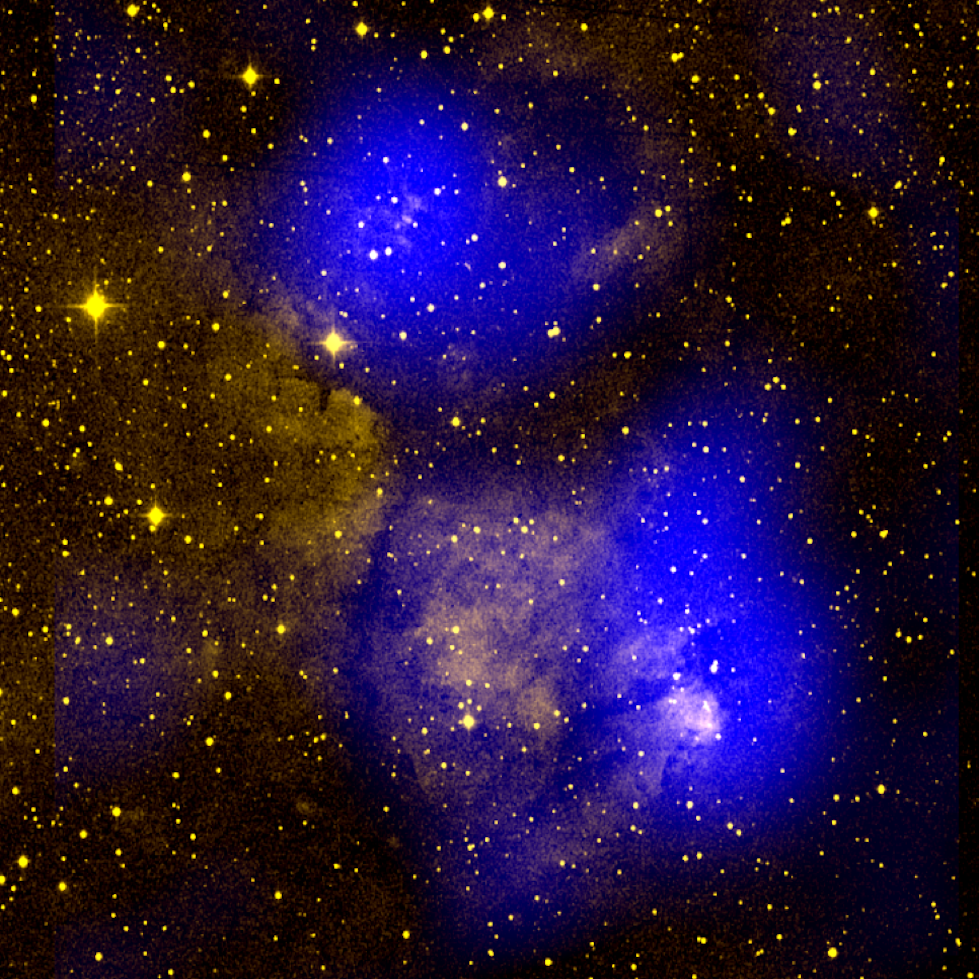
Radio (VLITE) and optical (DSS) image of the W3 Main and W3 North Complexes in the W3 star-forming region, located about 6000 light
years from Earth in the Perseus arm of the Milky Way galaxy. The radio data were fully processed through the VLITE pipeline.
(Credit: Radio (blue) from VLA Low-band Ionosphere and Transient Experiment on the NRAO VLA. Optical (yellow) from the Digital Sky Survey.
U.S. Naval Research Laboratory/ Dr. Tracy Clarke)
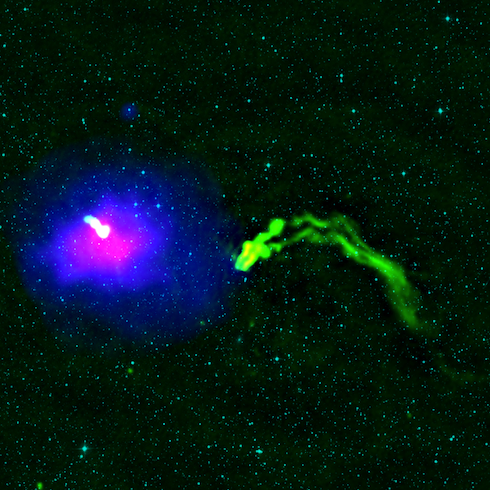
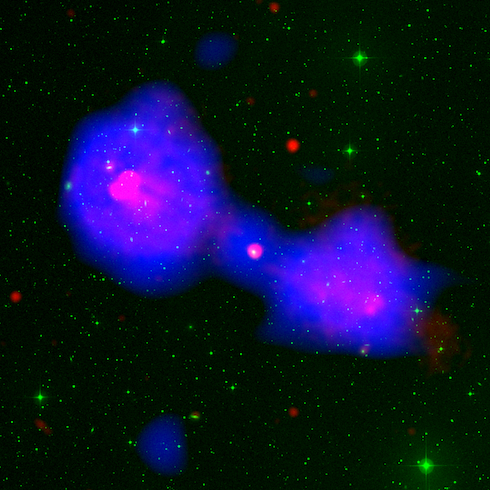
Radio (VLITE), X-ray (Chandra) and optical (DSS) image of the 3C 129 galaxy cluster. The VLITE data were fully
processed through the VLITE pipeline. (Credit: Radio (green and white) from VLA Low-band Ionosphere and Transient Experiment.
X-ray (blue and magenta) from the Chandra X-ray Observatory. Optical (cyan) from then Digital Sky Survey 2.
U.S. Naval Research Laboratory/ Dr. Simona Giacintucci).
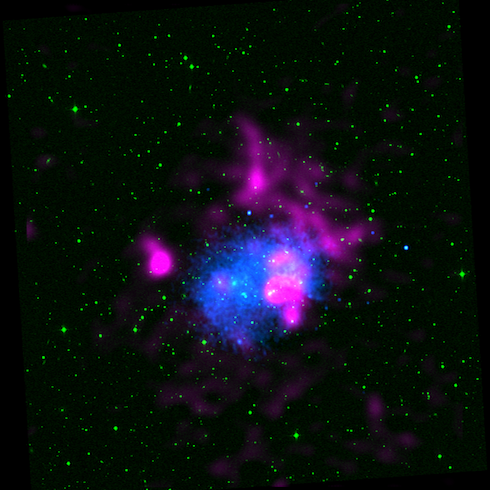
Radio (VLITE), X-ray (Chandra) and optical (DSS) image of the Abell 2255 galaxy cluster. The VLITE data were calibrated through
the VLITE pipeline and then imaged manually. (Credit: Radio (magenta) from VLA Low-band Ionosphere and Transient Experiment.
X-ray (blue) from the Chandra X-ray Observatory. Optical (green) from then Digital Sky Survey 2. U.S. Naval Research Laboratory/ Dr. Simona Giacintucci).
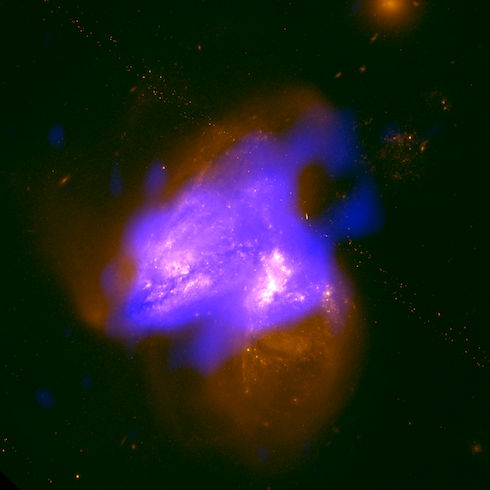
Radio (VLITE) and optical (HST WFC3) image of Arp 299, a pair colliding galaxies located about 140 million light years
from Earth. The VLITE data were calibrated through the VLITE pipeline and imaged manually. (Credit: Radio (blue)
from VLA Low-band Ionosphere and Transient Experiment. Optical (orange) from the Hubble Space
Telescope Wide Field Camera 3. U.S. Naval Research Laboratory/ Dr. Simona Giacintucci).
Radio (VLITE 90 cm and WSRT 50 cm) and optical (DSS) image of the giant radio galaxy DA 240. The VLITE data were fully
processed through the VLITE pipeline. (Credit: Radio (blue) from VLA Low-band Ionosphere and Transient
Experiment and (magenta and red) from the Westerbork Synthesis Radio Telescope. Optical (green) from the Digital Sky Survey 2.
U.S. Naval Research Laboratory/ Dr. Simona Giacintucci).
js slider
Examples of total intensity radio images are shown above. The images of NGC 6946, W3 Main
and W3 North Complexes, 3C 129, and DA 240 were fully processed using the VLITE astrophysics
data processing pipeline. In the case of Abell 2255 and Arp 299, the data were calibrated
using the processing pipeline and then they were imaged manually.
Astrophysics Data Processing Pipeline
The astrophysics data processing pipeline includes:
- automated excision of radio frequency interference
- delay calibration
- bandpass and flux density scale calibration
- imaging of each target
- up to two rounds of phase-only self-calibration (if feasible) and (when
appropriate) amplitude self-calibration
The output of the data processing pipeline includes:
- observation logs and source catalog
- antenna diagnostic plots
- calibration tables
- calibrated uv data
- multi-frequency image cubes
- broadband total intensity (Stokes I) images
The images and source catalog feed back into the transient search components of the project.
The quality of VLITE images produced depends on a number of factors, including the total
on-source time. The visibility-plane filling factor for data plays a critical role in
determining the impact of sidelobes on the sparse VLITE array. For any given total
integration time, VLITE data which are spread over a large hour angle will generally have
much better image fidelity than data from the same total time observed over a smaller
(continuous) hour angle.
Below we provide examples for several VLA configurations of the typical field-of-view (FoV)
processed by the VLITE astrophysics pipeine, the synthesized beam (θ), and the typical
rms (σ) level in a 10 minute VLITE image. The rms level is appropriate for the 16-18
antenna VLITE observations, data from the VLITE 10 observations (November 2014 - July 2017)
are significantly less sensitive.
VLITE 18 Antenna Specification
| Config. |
FoV |
θ |
σ (10 min) |
| A |
2° |
5" |
2.1 mJy |
| B |
3.5° |
15" |
5.4 mJy |
| C |
6° |
45" |
8.6 mJy |
| D |
8° |
150" |
21.8 mJy |
Modified on
Friday, 02-Jun-2023 11:03:52 MDT
|
